
Five ways to measure the economics of a good customer experience
Five calculations that put an amount in kroner on loyalty, engagement and lost customers, each with a worked example you can redo with your own numbers.
If you are responsible for customers or for a budget, you carry a few targets with you all the time: revenue, number of customers, earnings. There are two ways to reach them. You can go after new customers and new money, or you can work systematically with the customers you already have.
The second way is usually the shorter one. When you know how your customers experience you, and you hold that up against your own key figures, a large part of the target is often already inside the customer base. It is worth finding out what is there before the hunt for new customers begins.
Here are five ways to do that. Each one turns the customer experience into an amount, and each one points at something concrete to do. The examples are illustrations; the point is to redo them with your own numbers.
What the calculations are for
Measuring the customer experience is not a goal in itself. The numbers earn their place when they help you decide where to focus, what to invest in, whether an improvement worked, which targets to set and when it is time to step in. An amount in kroner makes those decisions easier to take and easier to explain to the rest of the organisation.
1. What a loyal customer is worth
Your customers’ loyalty and your employees’ engagement are among the most useful things you can measure. Loyal customers buy more and stay longer. They cost less to serve, and they tend to give you one more chance when something goes wrong. They also bring new customers with them, because they recommend you.
The calculation. Take the average yearly earnings for the customer group and multiply by the number of years they have been customers. Add the value of the new customers they have recommended to you. Then do the same for your disloyal customers, but subtract instead: the value of the customers who chose someone else because of what they heard.
| The loyal customer: buys more, for longer | |
|---|---|
| Earnings over the customer’s lifetime | DKK 25,000 |
| Earnings from the customer’s recommendations | DKK 20,000 |
| Result | DKK 45,000 |
| The disloyal customer: buys less, leaves sooner | |
|---|---|
| Earnings over the customer’s lifetime | DKK 10,000 |
| Earnings lost because the customer does not recommend you | −DKK 20,000 |
| Result | −DKK 10,000 |
In this example the distance between the two customers is DKK 55,000. Most of it does not show in the customer’s own invoices. It sits in what they say about you to others.
2. What ten per cent more engagement is worth
The employees who meet customers are the link between the customers and the business. In each contact the employee is your ambassador, and what they do shapes how the customer judges you afterwards. Their motivation and their will to do the job well are the fuel for loyal customer relationships.
The calculation. Engagement shows in behaviour, and behaviour can be counted: how many customers an employee is in contact with, how many of those contacts lead to a sale, and how large the sale is. Better contact uncovers more of what the customer needs, which gives more add-on sales and more sales of new products and services. See what happens when each of the three rises by ten per cent. The example follows one employee with five customer contacts a day over 200 working days.
| Now | With 10% more | |
|---|---|---|
| Customer contacts a year (200 days × 5, then × 5.5) | 1,000 | 1,100 |
| Share that succeed | 50% | 55% |
| Successful contacts | 500 | 605 |
| Average revenue per successful contact | DKK 2,000 | DKK 2,200 |
| Revenue a year | DKK 1,000,000 | DKK 1,331,000 |
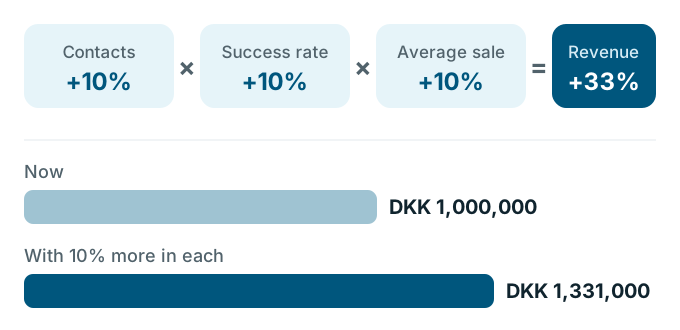 Ten per cent in three places is not ten per cent in total. The three multiply, to 33 per cent.
Even when only one of the three moves, revenue rises by ten per cent, or DKK 100,000 in this example.
3. What a lost customer costs
How the customer base develops, and why customers leave, tells you how good the business is at keeping and attracting customers. A short survey sent to customers who have left can give you the specific reasons.
A customer base is what a business lives on.
The calculation. What does it cost you to replace a lost customer? Remember the earnings you lose until the customer is replaced, and then the costs of getting the next one: marketing, the salesperson’s time, and the work it takes the organisation to get a new customer started.
| Replacing one lost customer | |
|---|---|
| Earnings lost until the customer is replaced | DKK 20,000 |
| Marketing costs | DKK 5,000 |
| Sales costs | DKK 10,000 |
| Onboarding the new customer | DKK 10,000 |
| Result | DKK 45,000 |
Put your own numbers in, and then work out what it would mean if you lost 20 per cent fewer customers. A business that loses 50 customers a year, at the cost above, would keep ten more of them and save DKK 450,000.
4. Share of wallet: where the unused potential is
Share of wallet is the part of a customer’s spending in your category that ends with you. When you combine what you know about your customers’ loyalty with what they buy today, you can see where there is room to sell more. You can also see which large customers may be on their way to another supplier.
The calculation has three steps:
- Find each customer’s loyalty from an NPS survey, and split the customers into two groups: loyal and disloyal.
- Work out revenue or earnings per customer, and split them into two groups again: above and below the average.
- Place the customers in the four squares the two splits give you.
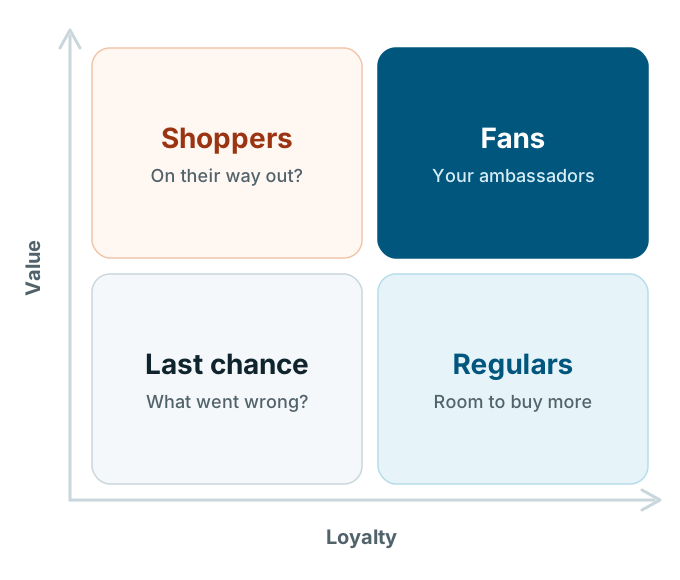 Value on one axis, loyalty on the other. Each square calls for something different.
- Fans are large and loyal. Activate them, so they recommend you to the people they know.
- Regulars are smaller but loyal. They often have room to buy more, or to buy other things you offer.
- Shoppers are large but disloyal. They may be on their way out. What would it take to make them loyal?
- Last chance customers are small and disloyal. Deal with them before what they say damages your reputation.
An example with 1,739 customers:
| Group | Loyalty and revenue | Customers | Average revenue |
|---|---|---|---|
| Fans | Loyal, above average | 341 | DKK 24,743 |
| Regulars | Loyal, below average | 728 | DKK 2,621 |
| Shoppers | Disloyal, above average | 527 | DKK 31,293 |
| Last chance | Disloyal, below average | 143 | DKK 1,692 |
Two things stand out. The 728 Regulars already like the business and buy for about a tenth of what the Fans buy; that is the room for more sales. And the 527 Shoppers have the highest average revenue of all, without being loyal. That is revenue that can leave.
5. The average value of each type of customer
Whether you deliver products or services, the experience is poor when the customer’s expectations are not met: in quality, in efficiency or in keeping to the agreed time. Splitting customers by how likely they are to recommend you gives you a simple way to see what that costs. A happy, loyal customer buys more. A disappointed one typically buys less.
The calculation. Split the customer base into three types by their answer to the recommend question: Promoters (9 or 10), Passives (7 or 8) and Detractors (0 to 6). Attach the last 12 months’ revenue to each customer. Work out the average revenue for each type.
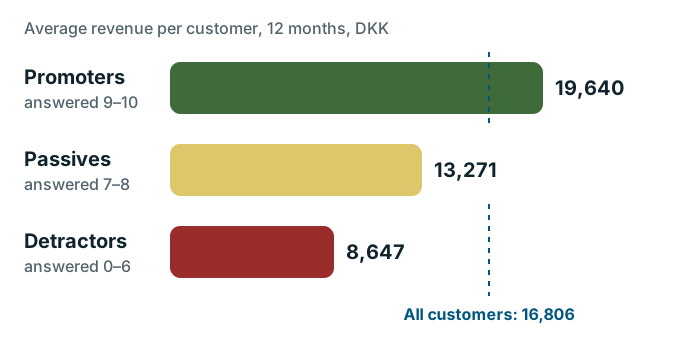 In this example a Promoter buys for more than twice as much as a Detractor.
| Type of customer | Average revenue, 12 months |
|---|---|
| Promoters: satisfied and loyal | DKK 19,640 |
| Passives: satisfied but not loyal | DKK 13,271 |
| Detractors: dissatisfied and not loyal | DKK 8,647 |
| All customers | DKK 16,806 |
The numbers differ from business to business. We have seen examples of average differences between Promoters and Detractors of well over 100 per cent in yearly revenue.
Where to start
Calculations 1, 4 and 5 rest on the same two things: what each customer answered, and what each customer is worth to you. Calculations 2 and 3 need only your own figures. If you do not have answers and revenue in one place yet, this order works:
- Start with number 5. It needs only the answer to one question and last year’s revenue per customer, and it gives you the first amount to show the rest of the organisation.
- Add number 3. The cost of a lost customer is a calculation you can do today from your own accounts, before a single survey is sent.
- Then number 4. Once customers are split by loyalty, the four squares turn the numbers into a list of customers to contact, and a reason for each call.
- Keep numbers 1 and 2 for the business case. They rest on more assumptions, and they are the ones that justify an investment in the customer experience over several years.
The groups come from the NPS survey; What is NPS? explains the question and the three groups.
Net Promoter®, NPS® and the NPS-related emoticons are registered trademarks of Bain & Company, Inc., NICE Systems, Inc. and Fred Reichheld. Net Promoter Score℠ and Net Promoter System℠ are service marks of Bain & Company, Inc., NICE Systems, Inc. and Fred Reichheld.
- LoyaltyEarnings per customer over the years, and which new customers came on a recommendation.
- EngagementCustomer contacts per day, how many succeed, and the average sale.
- Lost customersEarnings from a lost customer, plus marketing, sales and onboarding costs for the next one.
- Share of walletEach customer's answer to the recommend question and their revenue.
- Average valueThe last 12 months' revenue for Promoters, Passives and Detractors.