
What is NPS?
NPS, the Net Promoter Score, is built on one question: how likely is the customer to recommend you? It measures loyalty and the relationship as a whole, not a single visit.
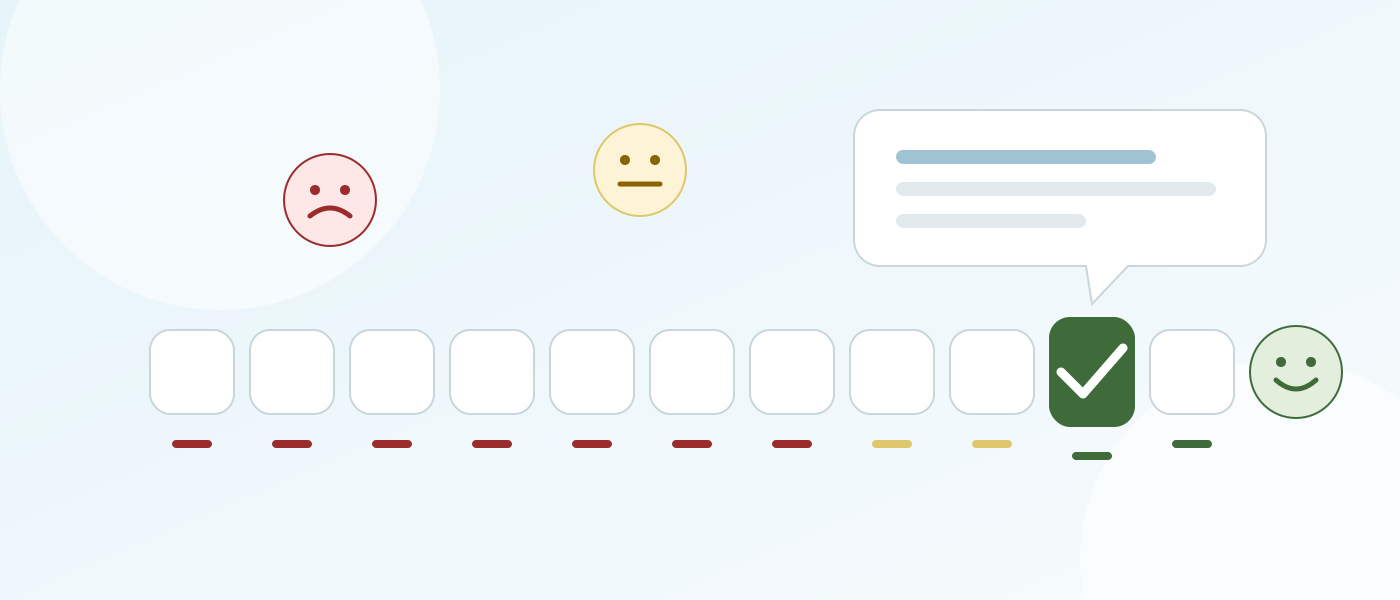
Net Promoter Score, NPS for short, is a way to measure how loyal your customers are. You ask them one thing: “How likely is it that you would recommend us to a friend or colleague?” They answer on a scale from 0 to 10, and the answers are turned into a single score between −100 and +100.
The method was developed by Fred Reichheld, a partner at the consultancy Bain & Company, and introduced in 2003 in his Harvard Business Review article “The One Number You Need to Grow”. It has since been taken up by businesses all over the world, because it is simple to ask, simple to answer and simple to follow over time.
This guide explains the recommend question, the three groups of customers it gives you, how the score is calculated, and what has to happen around the score before it changes anything.
The question, and the one that follows
The survey starts with one question:
On a scale from 0 to 10, how likely is it that you would recommend us to a friend or colleague?
The customer picks a number. 0 means not at all likely, 10 means very likely. That is the part you can count. Straight after, they are asked why:
What is the main reason for your score?
That is the part you can learn from. You can add a third question, “What could we do better?”, and that is enough.
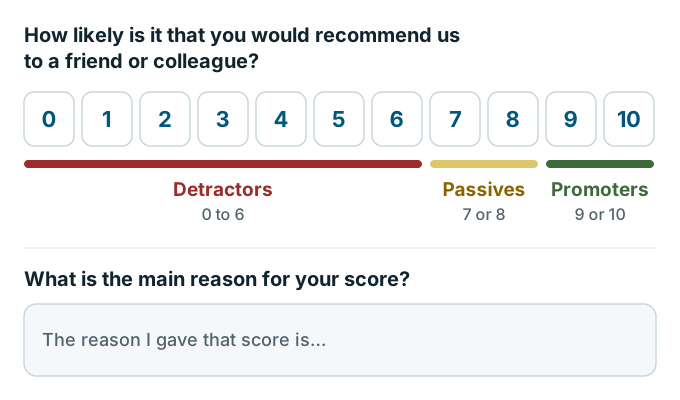 One number and one reason. That is the whole survey.
Because the survey is this short, you can send it often: after a purchase, a visit, a delivery or a closed support case. You get answers all year, not once a year, and you can adjust course while it still matters.
Three groups of customers
The answer places each customer in one of three groups. The names are fixed, and by convention so are the colours they are shown in: green, yellow and red.
| Answer | Group | What it tells you |
|---|---|---|
| 9 or 10 | Promoters | Satisfied and loyal. They buy again, and they recommend you to others. |
| 7 or 8 | Passives | Satisfied, but not loyal. They have no complaints and no reason to stay if a better offer comes along. |
| 0 to 6 | Detractors | Dissatisfied and not loyal. Some will advise the people they know against you. |
The scale is strict on purpose. A 7 or an 8 sounds like a good mark, but a customer who is merely satisfied rarely goes out of their way to recommend you. Only the Promoters, who answer 9 or 10, can be expected to recommend you, and that is the behaviour the question is about.
How NPS is calculated
Take the share of Promoters and subtract the share of Detractors. The Passives count in the total, but they are neither added nor subtracted.
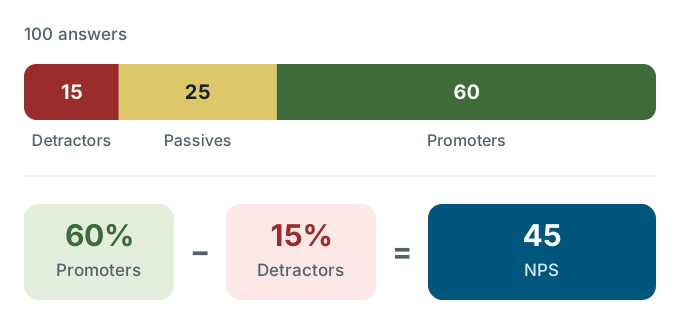 An example with 100 answers. NPS is a number, not a percentage.
The score runs from +100, if every customer is a Promoter, to −100, if every customer is a Detractor. If every customer is a Passive, the score is 0.
A higher score means that more of your customers are loyal and would recommend you. A lower one means that more are dissatisfied and may advise others against you. The most useful comparison is with yourself: the same score last month, last quarter and last year, and the score for each location, department or product next to the others.
The number and the reason
The survey gives you two kinds of answers, and they do different jobs.
The number lets you follow the business with one figure. It shows whether loyalty is rising or falling, and where.
The reasons tell you why. The comments describe, in the customers’ own words, what they like, what they do not like and what could be better. This is where you find out what creates loyalty as the customer sees it, and what works against it. From these answers you can pick out the improvements that build loyalty, decide which come first and get them started.
For that reason the comments are more important than the score. A business that looks only at the final number knows that something has changed. A business that reads the comments knows what to do about it.
Growth you earn
Why ask about recommendations, and not simply about satisfaction? Because recommendations are where loyalty turns into growth.
Some of your new customers come to you because an existing customer recommended you. That part of your growth is earned, and is often called earned growth: it comes from the experience you have already delivered, not from the marketing budget. It is a healthy sign in a business, because it is growth that keeps coming as long as the experience holds. It is also marketing you do not pay for.
The score shows which way this is going. When there are more Promoters, more customers talk about you, and more new customers arrive on a recommendation. When there are more Detractors, the recommendations dry up, and in some cases customers actively advise their network against you.
The score is where the work starts
The simplicity of the method sometimes creates a misunderstanding: that it is all about one question and one score. That is only the starting point.
Nobody ever lost weight by stepping on the scales. It takes an effort before you step on them again.
Two things go by the name NPS, which can be confusing. The Net Promoter Score is the indicator. The Net Promoter System is the way of working that raises it: collecting the feedback, finding the specific problems, making the improvements and telling customers what happened. In practice it is a circle with four parts.
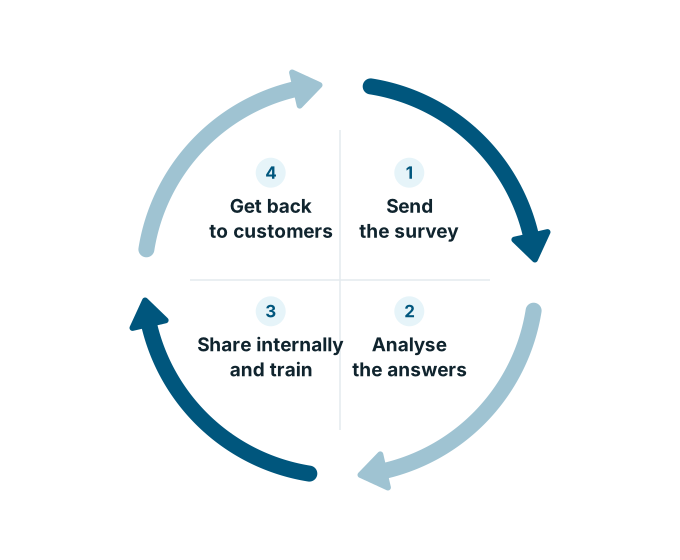 The communication circle. It runs continuously, not once a year.
- Send the survey. Short, and close to the experience it asks about.
- Analyse the answers. Follow the score, and read the comments for the reasons behind it.
- Share inside the business. Give the feedback as quickly as you can to everyone who has contact with customers: sales, customer service, the customer teams, the product manager. People in the back office need it too. Where the answers show a gap, train.
- Get back to customers. Contact the customers whose feedback calls for a conversation. Solve the individual problem, find the process that caused it, and note what created the Promoters so you can do more of it.
Then the circle starts again, and the next round of answers shows whether the work made a difference.
Employees are the key
The customers’ experience is delivered by your employees, so the system only works when they are part of it. Ask yourself: do your employees treat customers the same way when you are not in the room?
A customer-focused culture is built from below, with employees who are involved and who can see the connection between the work they do every day and what it means for a customer. When they can, they bring energy and ideas to the job. When they cannot, the job is a set of instructions.
Building from below does not let management off. It has to go first. Make it a stated priority to earn the loyalty of customers and employees, show it in what you do yourself, and expect the same of others. Employees want happy customers, but it has to be done in a way that makes financial sense, so they need the knowledge and the tools to do it. Management, for its part, has to understand how different the economics of Promoters, Passives and Detractors are; Five ways to measure the economics of a good customer experience puts numbers on it.
When to use it, and when not
NPS is the right measure when you want to:
- measure the overall loyalty of your customers
- benchmark yourself, between your own locations or against other industries
- work on keeping customers and on your reputation
It shows how customers experience the business as a whole. It does not tell you everything about one particular experience. If you want to know how a specific visit, delivery or support call went, a satisfaction score answers that more directly. The two work well together, and Which measure to use when compares them.
How to get started
A full roll-out, with systems, training and every level of management involved, is a real investment. You do not have to begin there. The most important thing is to start asking your customers about their experience and to share what they say with the organisation.
- Decide when to ask. Pick one or two points where customers have just dealt with you.
- Keep it to two or three questions. The recommend question, the reason for the score, and perhaps what you could do better.
- Read every comment. At the start there are few enough to read them all.
- Share the answers every week. With everyone who meets customers, not only with management.
- Call the Detractors. Soon, and to listen. Solve the problem where you can.
- Follow your NPS over time. By location, department or product, week by week, so you can see what your own efforts change.
Even five minutes a week spent on the answers can pay off, and the return grows with the attention you give it. The pitfalls are well known; Seven misunderstandings about measuring loyalty lists the common ones.
Net Promoter®, NPS® and the NPS-related emoticons are registered trademarks of Bain & Company, Inc., NICE Systems, Inc. and Fred Reichheld. Net Promoter Score℠ and Net Promoter System℠ are service marks of Bain & Company, Inc., NICE Systems, Inc. and Fred Reichheld.
- QuestionHow likely is it that you would recommend us to a friend or colleague? Answered from 0 to 10.
- GroupsPromoters answer 9 or 10, Passives 7 or 8, Detractors 0 to 6.
- NPSThe share of Promoters minus the share of Detractors, from −100 to +100.
- Follow-upWhat is the main reason for your score? The reasons matter more than the number.
- Use it forLoyalty and the whole relationship. Use a satisfaction score for a single visit or delivery.